
Understand what matters
Reporting that tells the story, benchmarks that give it context
A score on its own does not tell leaders what to do. TalentMap pairs clear, role-based reporting with relevant comparisons and expert interpretation so each audience can see what matters and why.
Reporting
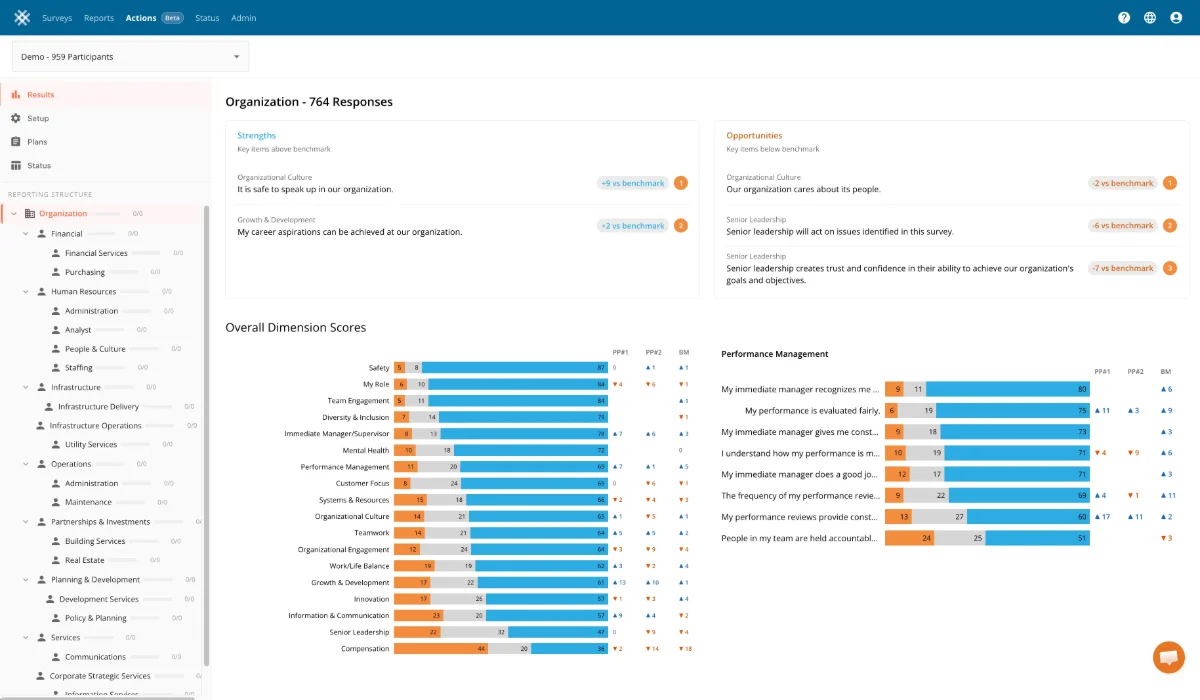
From the organization-wide story to the team result
Dashboards for every level
Executives see strengths and opportunities at a glance. Managers see their team without exposing individuals.

Heatmaps and comparisons
Compare departments, locations and demographic groups to see where experiences differ.

Comment analysis
Read what employees wrote, grouped by theme, so the numbers come with the reasons behind them.

Trends over time
Track change from the previous period to see whether actions are being felt.
Key driver analysis
See which factors are most connected to engagement so priorities are grounded in evidence.

Exports and presentations
Take results into board decks and team meetings with exports built for sharing.
Benchmarks
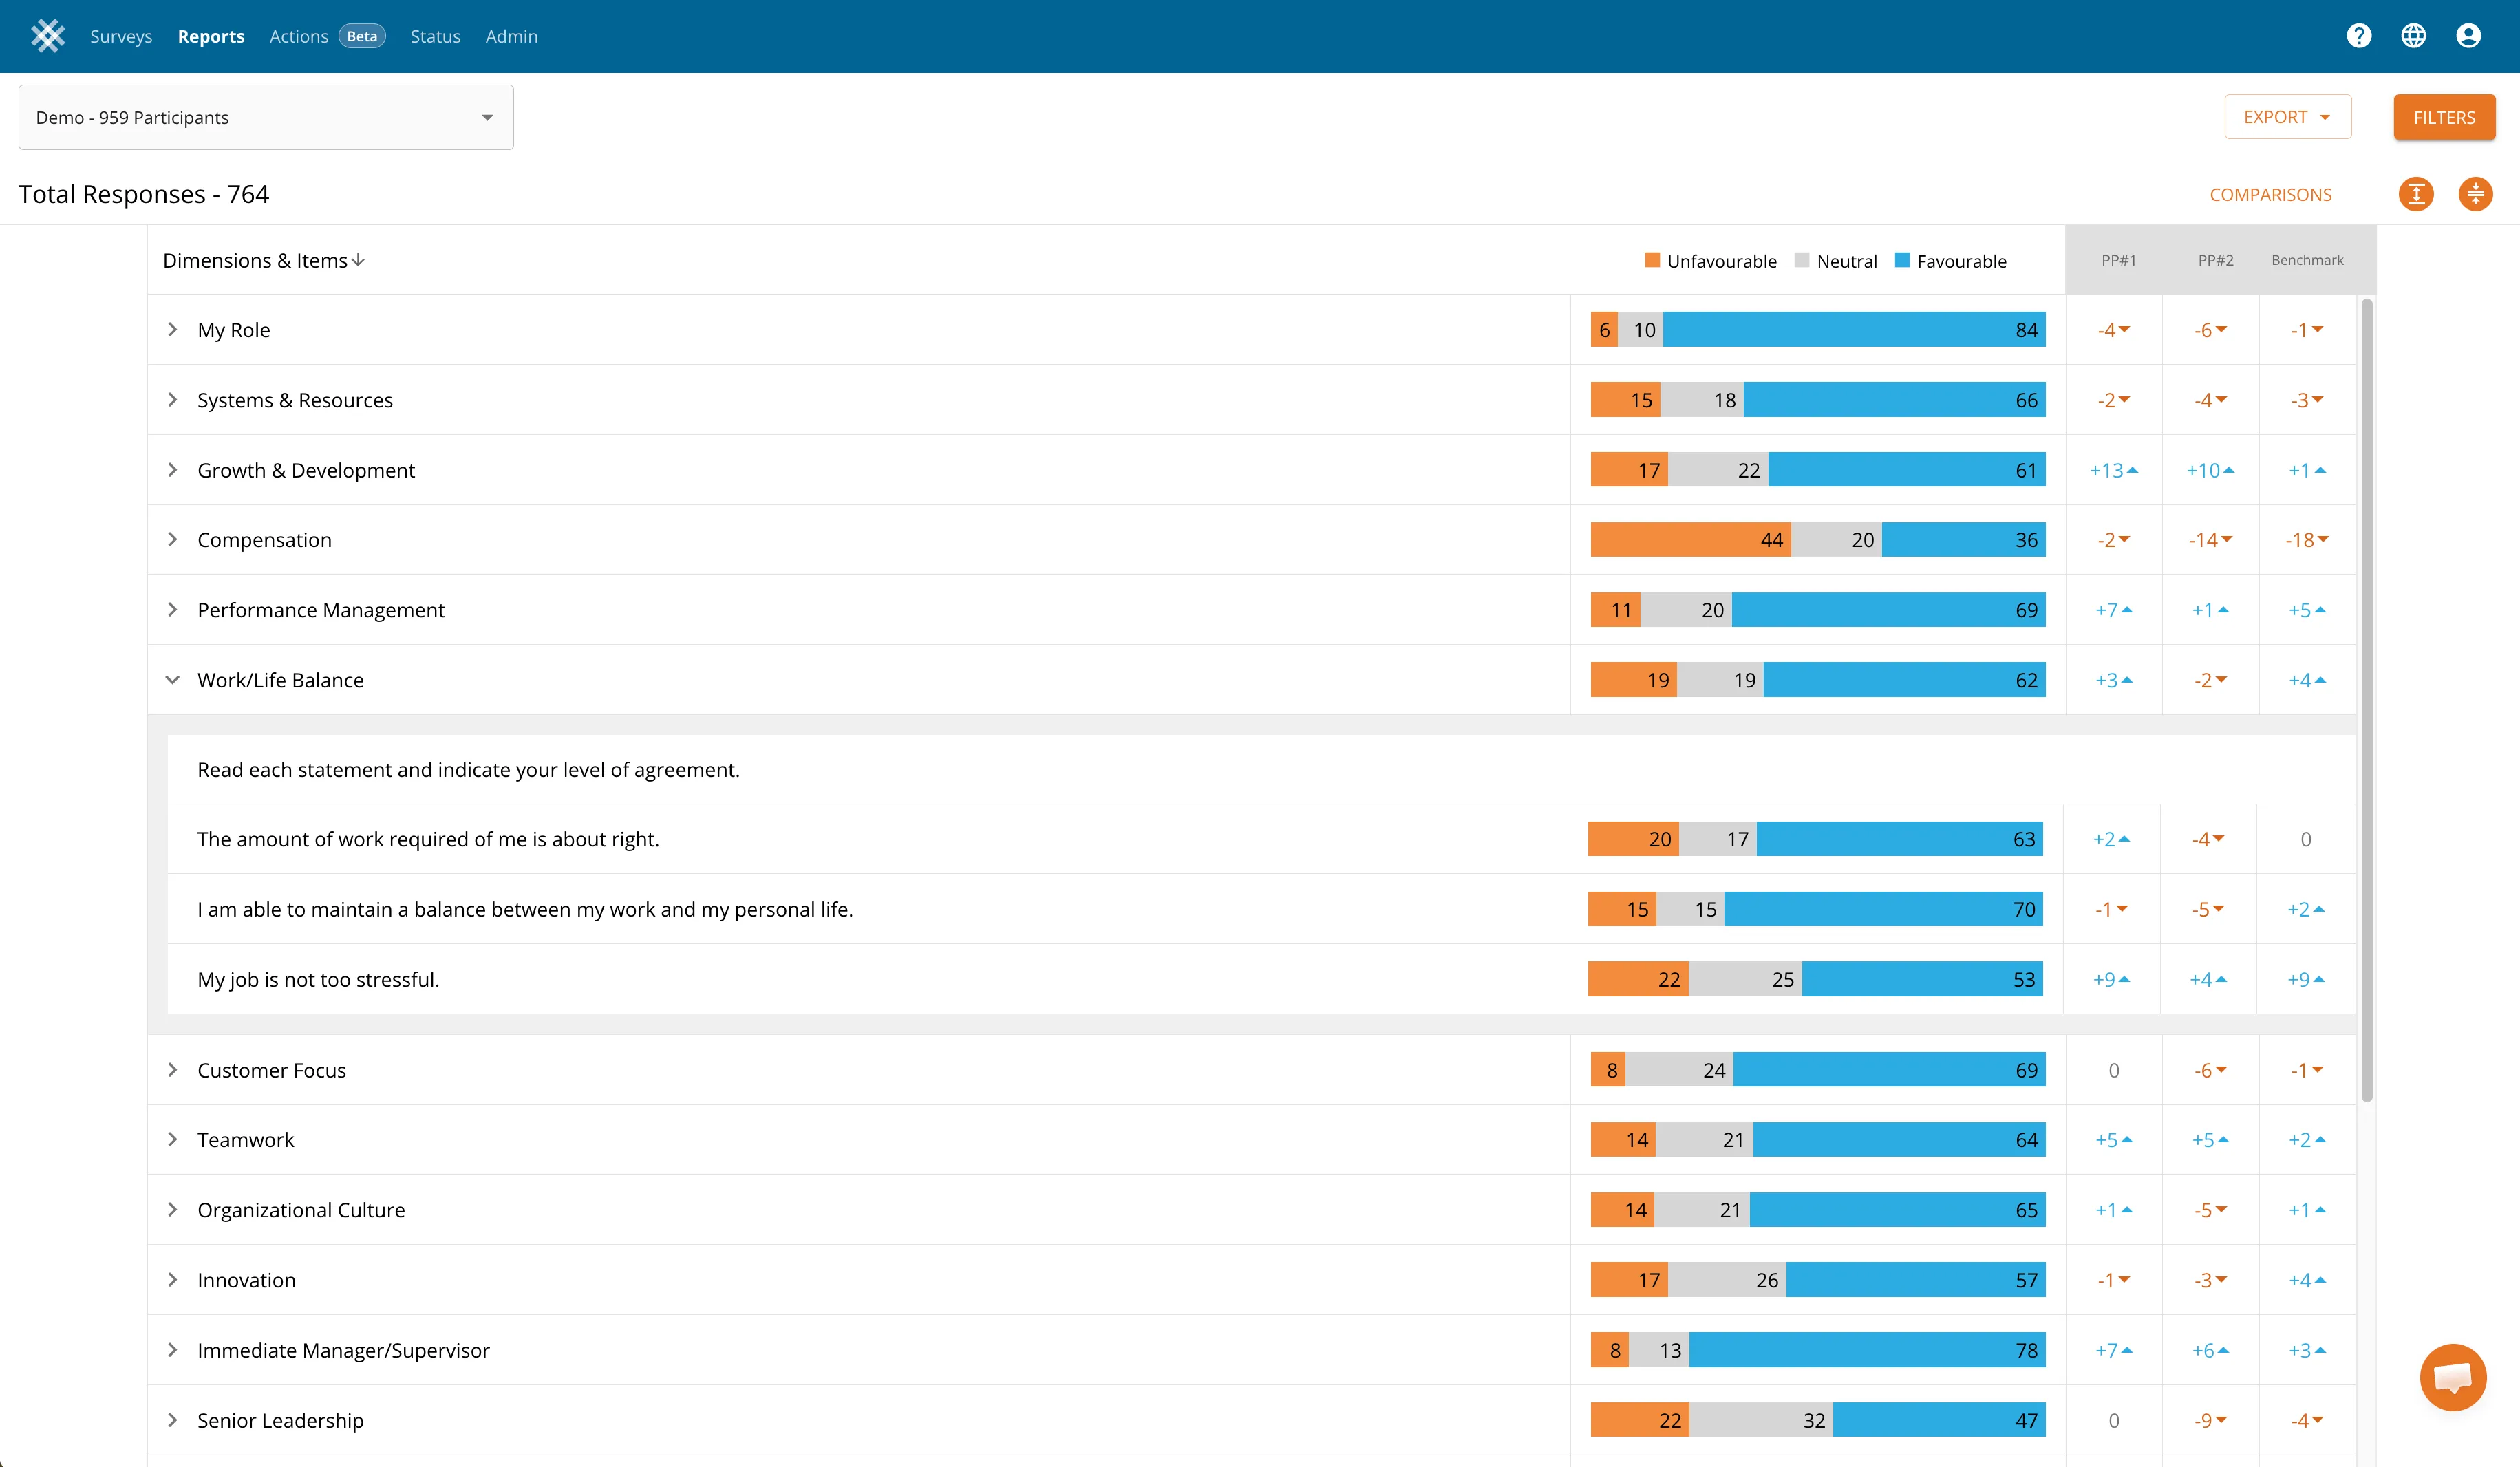
Compare with organizations like yours
A 72 percent favourable score means something different in a municipality than in a software company. TalentMap compares your results with relevant industry and public-sector norms where available, so leaders can tell a real strength from a sector-wide pattern.
We are clear about what each benchmark contains, how current it is and where a comparison should be read with care.
Expert interpretation
Numbers need a narrator
TalentMap's people help you separate signal from noise, explain what the pattern means for your organization and prepare the story for executives, governance bodies and managers.

See your results the way your leaders will
We will walk through reporting and benchmarks using a fictional organization that looks like yours.